
This article is an excerpt from the Shortform book guide to "A Random Walk Down Wall Street" by Burton G. Malkiel. Shortform has the world's best summaries and analyses of books you should be reading.
Like this article? Sign up for a free trial here .
What is the random walk hypothesis? How does it prove that the future of stocks doesn’t depend on its past, but instead resemble a “random walk”?
Many investment theories rest on the assumption that the past movements of stocks give an indication of future trends. However, Burton Malkiel’s random walk hypothesis debunks this idea, claiming that the rise and fall of the stock market resembles a “random walk” rather than any noticeable trends.
Keep reading for more about the random walk hypothesis.
The Random Walk Hypothesis and Technical Analysis
Before looking at the random walk hypothesis in detail, it’s important to understand technical analysis. This is because the random walk hypothesis is one of the best arguments against technical analysis.
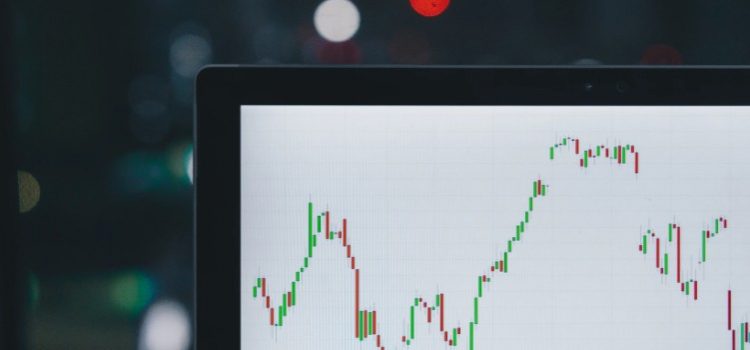
Technical analysis relies on stock charts—graphs of past price movements and trading volumes—to predict future price movements.
Technical analysts adhere to two primary principles: (1) that all economic data—revenues, dividends, and future performance—are reflected in a stock’s past prices; and (2) that stock prices tend to follow trends (if a price is rising, it will continue to rise, and vice versa).
One of the technical analyst’s core principles is that price trends tend to be self-fulfilling—that is, if a stock’s price is rising, it will continue to rise for no other reason than the trend itself.
Researchers have found, however, that a stock’s past doesn’t reliably indicate its future. (Shortform note: Anyone who has read a fund’s prospectus will have seen the disclaimer that “past performance is no guarantee of future results.”) Although there’s some evidence to suggest there are brief spells of market momentum, there are just as many sharp reversals in momentum.
The Random Walk Hypothesis
When enough price data is compiled, what researchers have discovered is that stock prices resemble a “random walk”—a mathematical concept that describes a value moving randomly up or down in a succession of “steps.” A classic example of a random walk is flipping a coin: If one is using a fair coin, there’s always a 50% chance one will flip either a head or a tail. The outcome of the flip is always random, and previous outcomes have no effect on present or future outcomes.
Although stock prices don’t conform precisely to the mathematical random walk—Malkiel calls market movement a “weak random walk”—enough comparative research has been done to establish that technical analysis doesn’t consistently outperform buy-and-hold strategies.
This means that in the long run, there’s no discernable “momentum” in stocks’ prices—rather, their price increases and decreases resemble a “random walk.”
The Problem of Randomness
One particularly problematic bias is our illusion of control: our perception that we can dictate events that are effectively random.
As noted above with regard to technical analysis, price movements in the market look more or less like the results of a coin flip or “random walk.” Yet investors persist in seeing patterns in these movements—for example, hot streaks or stock “momentum”—that cause them to make bad decisions.
No matter how lucid and well-founded an investor’s value determination is, he or she simply cannot account for randomness—the appearance of a groundbreaking technology, a new legal regime, or a “Black Swan” (surprise event) like a public-health or environmental emergency.
Financial history is littered with “sure things” derailed by randomness; even utility stocks, which are widely seen as some of most consistent, are at the mercy of state authorities and global fuel dynamics. Cautionary tales are especially prevalent in pharmaceuticals. In 2013, Celsion Corporation lost 90% of its value due to a failed trial of a promising liver cancer drug.
What Can We Learn?
Economist Burton Malkiel claims that Investors are better off putting their money in a passively managed index fund—a total market index fund, to be precise—than trading stocks themselves or investing in an actively managed mutual fund.
This is supported by the random walk hypothesis, as investors can’t control the randomness of the stock market.
For example, an investor who put $10,000 into an S&P 500 Index Fund in 1969 would have had a $1,092,489 portfolio in April 2018 (assuming all dividends were reinvested). An investor who put the same amount of money into an actively managed fund would’ve only had $817,741.

———End of Preview———
Like what you just read? Read the rest of the world's best book summary and analysis of Burton G. Malkiel's "A Random Walk Down Wall Street" at Shortform .
Here's what you'll find in our full A Random Walk Down Wall Street summary :
- A comprehensive and entertaining introduction to the world of finance
- Practical investment principles that work for every skill level
- The advantages of index investing


