
This article is an excerpt from the Shortform book guide to "How to Lie With Statistics" by Darrell Huff. Shortform has the world's best summaries and analyses of books you should be reading.
Like this article? Sign up for a free trial here .
How can people manipulate graphs to change how you perceive them? What are the six most common forms of image manipulation?
It is possible for someone with an agenda to manipulate an image (whether that be a graph, a map, or a photo) to control the message you take away from them. You’d be surprised how often this happens in business and advertising.
Keep reading to learn how manipulated graphs can support an agenda.
What Are Manipulated Graphs?
In this article, we’ll look at a way that people with an agenda can report numbers—with misleading and manipulated graphs.
Here are some ways that liars lie in graphics. They:
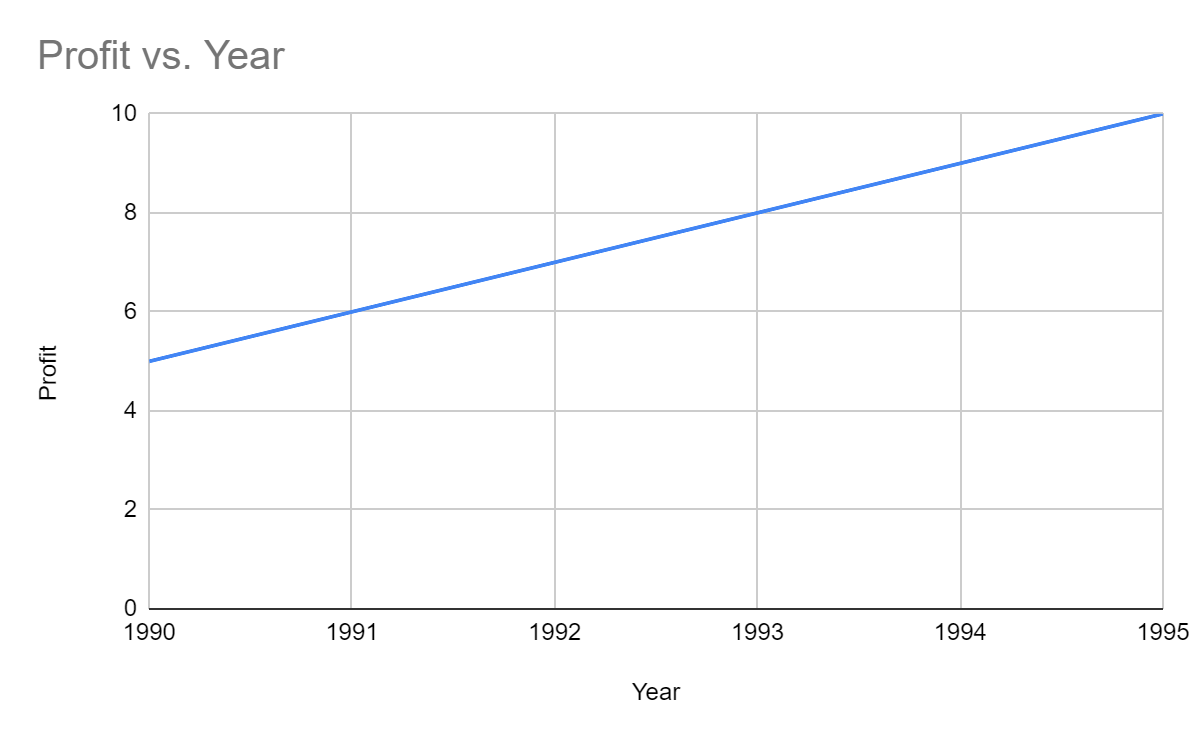
1. Truncate the graphs. To make changes look larger than they are, liars remove the empty space on a graph so that the part the data occupies is the only part shown. This will make the slope of a line look steeper, or the difference between bars look greater.
- For example, from this graph, it’s clear that profit is steadily growing:

On this truncated graph, however, it appears that profit is rapidly growing, because the empty space is gone:
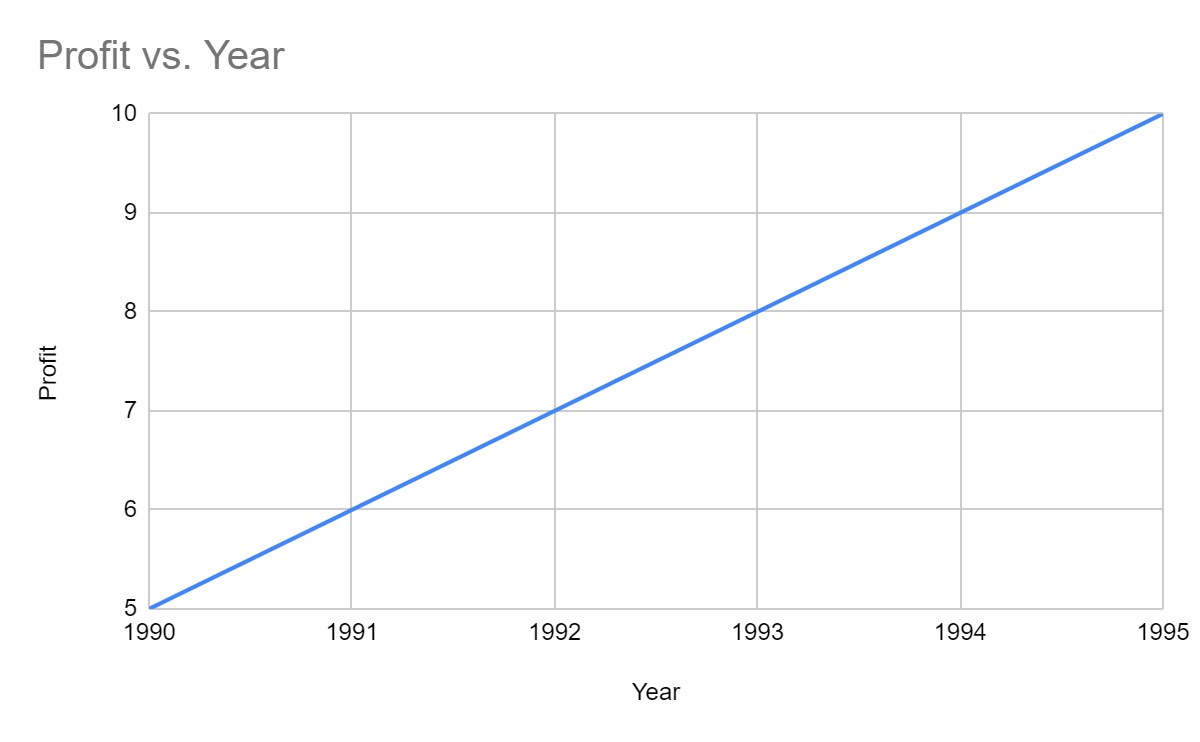
2. Add more divisions to the y-axis. Like truncation, this will visibly amplify the differences between measures.
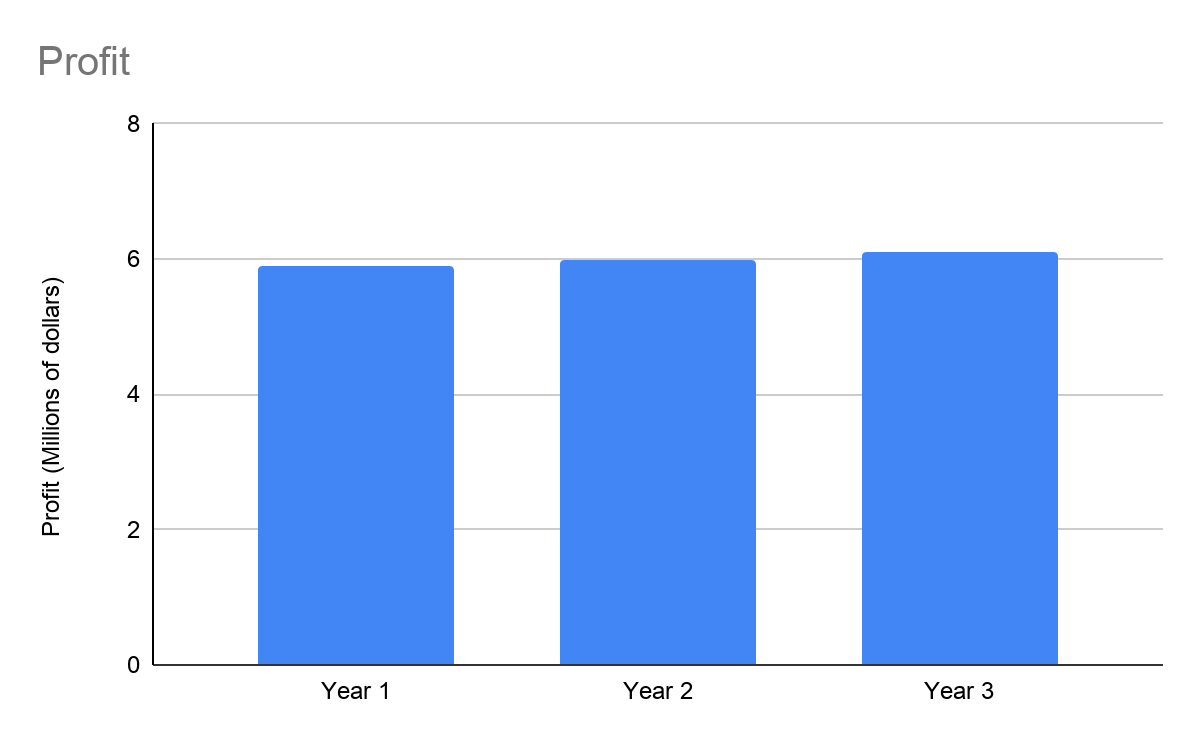
- For example, from this graph, it’s obvious that there’s little difference in profit from year to year:

In this manipulated graph, which uses the same data as the first graph but has more divisions and has been truncated, profit looks significantly different from year to year:

3. Leave the graph labels and numbers out. To be meaningful, diagrams and graphs need labels and numbers, otherwise, it’s impossible to know what they show.
- For example, one advertising agency presented a graph that showed a steadily rising line. The y-axis showed time in years, but the x-axis had no label. Presumably, it was profit, but without numbers, it was impossible to know if profits were jumping by millions or cents.
4. In bar graphs, use illustrations instead of bars. In a bar chart, the height of the bar is what indicates the measurement. When you replace a bar with an illustration—say, a bag of money—when you increase the height of the moneybag, all the other dimensions scale proportionally. Increasing the width and depth (if 3-D) of the image makes the differences between the two images look much larger.
- (Shortform example: In the illustration below, the skulls represent the death rate from a certain illness. Before a liar’s medication was adopted, the death rate was 60 out of 1 million, represented by a skull at height 60. After adoption, the death rate halved to 30, represented by a skull at height 30. However, visually, the rate appears to have dropped by far more than half because the image appears to have decreased by more than half: The whole image was scaled down proportionally, rather than just the height being halved.
Death rate pre-adoption:💀Death rate post-adoption:💀
This trick can also give a false impression, depending on the illustration, that whatever’s represented in the image is now larger than it used to be.
- For example, if a graph compares the size of the cow population between two years, but uses two images of cows, one smaller and one bigger, people might think the size of cows has increased instead.
5. In before-and-after photos, change multiple things about the subject after the before picture has been taken to make the change look more significant than it really is.
- For example, a photo of a woman before she started using a hair rinse might be taken with poor lighting and printed in black and white. In the after photo, she might be well-lit and smiling, and the photo might be printed large in full color. The after photo looks better not because the hair rinse made her hair look better, but because the photography was better.
6. In maps, use the many variables to create visual illusions. Since maps include many features (legends, border, different-sized regions, and so on), they’re excellent tools for misdirection.
For example, the First National Bank of Boston produced a map called “The Darkening Shadow” that showed how much of the national income is spent by the federal government. The spending was represented by shading in enough states that federal spending was equal to the total income of those states.
Of course, states have different areas and populations. The bank chose to shade the states with small populations (and therefore low total incomes) and large areas. As a result, their map shows over half of the western United States shaded, which makes federal spending look huge.
It would have been just as accurate to shade the small, highly populated states such as the ones on the eastern seaboard. Choosing this method, only a small portion of the map would be shaded, and the spending looks small—but this wouldn’t have suited First National’s agenda, so they didn’t do it.
———End of Preview———
Like what you just read? Read the rest of the world's best book summary and analysis of Darrell Huff's "How to Lie With Statistics" at Shortform .
Here's what you'll find in our full How to Lie With Statistics summary :
- The 10 ways you might end up fooled by statistics
- How to differentiate between legitimate and lying statistics
- Why you can't even trust a graph


