

This article is an excerpt from the Shortform book guide to "The Great Mental Models Volume 3" by Rhiannon Beaubien and Rosie Leizrowice. Shortform has the world's best summaries and analyses of books you should be reading.
Like this article? Sign up for a free trial here .
As you go through life, how clearly are you seeing things? Are you seeing them in their true and full context?
You’ll stand the best chance of success if you have an accurate view of the world. Unfortunately, because each of us has a limited perspective, sometimes it’s hard to see the big picture—and easy to misinterpret some situations as a result. The Great Mental Models Volume 3 argues that understanding distributions—a model drawn from mathematics—can help us see the big picture more clearly. The basic idea is that, by thinking statistically, you’ll have a clearer context for the things you encounter.
Read more for some unconventional advice on how to look at the bigger picture.
Looking at the Bigger Picture
Authors Rhiannon Beaubien and Rosie Leizrowice argue that, if you want to learn how to look at the bigger picture and have accurate contexts for information, you need to understand probability distributions. In statistics, a distribution describes how likely different results are in a given data set. The best-known distribution is probably the bell curve—in technical terms, it’s called a normal distribution.
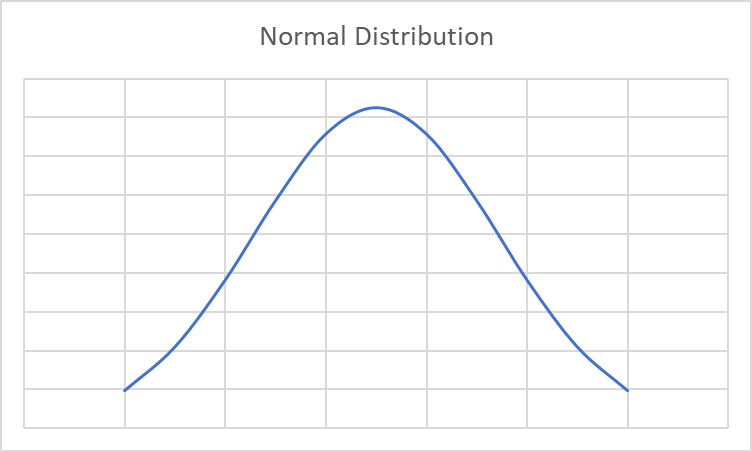
In a normal distribution, most of the values are somewhere near the middle with values becoming less common the more they deviate from the average. Often, student grades work this way, with Cs being more common than Bs or Ds, which are more common than As or Fs. (Shortform note: We tend to think that the more average something is, the more common it is. That’s true in the normal distribution, but it’s not always true in life. As we’ll see in a moment, equating averageness with commonness can lead to serious misconceptions of real-world situations.)
While the normal distribution is familiar and widespread, Beaubien and Leizrowice point out that many important phenomena follow other distributions, such as the power law distribution.

Power law distributions describe situations where most items cluster around either a high or low point on the scale rather than clustering around the middle. The further from the high or low point, the less likely a value is. For example, most of us aren’t especially fast sprinters. If the chart above measures 100 meter dash times, with better times on the right side of the chart, most people will be near the left—that’s why the curve is highest there. As you move from left to right, you’ll find fewer people (high school athletes), then fewer still (college athletes), then fewer still (Olympic athletes) until at the far end you find Usain Bolt.
| The Importance of Understanding Distributions A major takeaway from this discussion of distributions is that you always need to look for the greater context for information, especially when you’re dealing with figures and statistics. You also need to remember that our intuitive notions about things like averages can sometimes lead us astray. For example, Beaubien and Leizrowice point out that wealth follows a power law distribution, with most of the world’s wealth concentrated among a few people while most people have exponentially fewer resources—in fact, recent studies show that .01% of the world’s population owns 11% of its wealth and that gaps in income and wealth have only widened over the past decade. If we want to address problems like wealth inequality, we first need to see them clearly. But if we don’t have a clear understanding of distributions, it’s easy to misinterpret the situation in a way that masks the problem. Take the idea of average income. In a normal distribution, average values tend to be more widespread. But that’s not true in a power law distribution. For example, imagine there are 10 people in a room. Nine of them make $30,000 per year. The 10th person makes $2,000,000 per year. The average income among these 10 people is $227,000. Obviously, that doesn’t tell us anything—none of the 10 people in the room make anywhere near that figure. But if all we knew was the average income, we might conclude that everyone in the room was quite wealthy (an individual annual income of $227,000 would put you in the top 3% of Americans in 2021). In other words, by not recognizing which distribution curve is at work, we might completely miss the income inequality among those 10 people. |
———End of Preview———
Like what you just read? Read the rest of the world's best book summary and analysis of Rhiannon Beaubien and Rosie Leizrowice's "The Great Mental Models Volume 3" at Shortform .
Here's what you'll find in our full The Great Mental Models Volume 3 summary :
- How to understand anything in the world by learning a finite set of rules and patterns
- A look at how humans are driven by algorithms
- Why you shouldn't be fooled by randomness


