The Limitations of Regression Analysis in Stats

The Limitations of Regression Analysis in Stats

What are the uses and limitations of regression analysis in statistics? What are some things you should keep in mind when reporting the results of regression analysis? Regression analysis is a powerful research tool as it allows researchers to isolate variables of interest. However, regression analysis can be dangerous if its results are misinterpreted or misreported. Here are a few pointers to keep in mind when interpreting regression analysis results.

The Key Causes of Age-Related Cognitive Impairment

The Key Causes of Age-Related Cognitive Impairment

What are the main factors implicated in age-related cognitive impairment? What are some things you can start doing today to slow down the rate of your cognitive decline? In the last few decades, medical scientists and researchers have discovered a lot about cognitive decline, dementia, and Alzheimer’s, and their research suggests it’s probably due to many factors that differ for every person. If we want to take care of our brains and take measures to prevent them from declining, it will be helpful to know the suspected factors that lead to cognitive decline. Keep reading to learn about the main

Is Obesity a Choice or a Disease? Doctor Explains

Is Obesity a Choice or a Disease? Doctor Explains

Why shouldn’t we blame obese patients for being dangerously overweight? Is obesity a choice or a disease? To answer this question, we must first understand the root cause of obesity. If obesity is caused solely by eating too much, then we could indeed attribute it to personal choice. However, the prevailing view of obesity as a problem of uncontrolled eating is simplistic and limited. Ultimately, obesity is a hormonal disorder. Here’s why obesity is a disease rather than a problem of self-control.

Understanding the Limitations of Descriptive Statistics

Understanding the Limitations of Descriptive Statistics

What is descriptive analysis? How do descriptive statistics help us make sense of data? What is the main pitfall of descriptive statistics as a research tool? Descriptive statistics take information in a data set and condense it into a meaningful figure like an average or percentile. Descriptive statistics help us summarize and describe data, characterize relationships, and make predictions. While descriptive statistics can help us make sense of data, they should be used with caution: Descriptive statistics tell us what happened, but they don’t necessarily tell us why. Keep reading to learn about the limitations of descriptive statistics.

Calculating Investment Risk Using Probability

Calculating Investment Risk Using Probability

How do you calculate investment risk? What do you need to know to calculate the expected payoff of a financial investment? Investors often use probability to assess risk when making financial decisions. This is typically done with a statistic called an “expected value.” To calculate the expected value of a financial investment, you need to know the probability of each possible outcome and its respective payoff. Here’s how to use the expected value statistic for calculating investment risk.

Carbs & Weight Gain: What You Should Know

Carbs & Weight Gain: What You Should Know

How do carbs contribute to weight gain? What kind of carbs should you avoid? Carbs are vilified because of their potential to raise your levels of insulin, which is a fat-storage hormone. However, not all carbs are created equal. Vegetables consist mostly of carbs, but they are good for you because they contain vitamins, minerals, and fiber. The kind of carbs you should avoid are refined carbs and added sugars. Here’s what you need to know about carbs and weight gain.

Normal Distribution: Explained With Examples

Normal Distribution: Explained With Examples

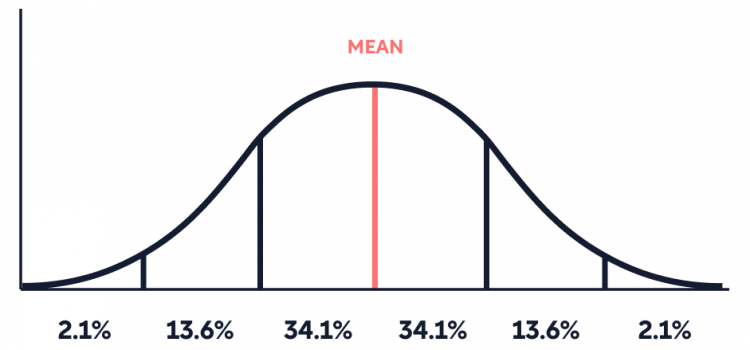
What is the normal distribution in statistics? How do measures of central tendency relate to the normal distribution? The normal distribution is a foundational concept in statistics. When data is normally distributed, it means that most values cluster around the center. Therefore, the mean, median, and mode are exactly the same in a normally distributed data set. Keep reading for the theory of normal distribution, explained in simple terms.

Mean and Mode: Which Should You Use?

Mean and Mode: Which Should You Use?

What is the difference between mean and mode? Which of the two is a more accurate measure? Both the mean and the mode are measures of central tendency. For non-skewed distributions, the mean is more accurate because it takes into account every value in the data set. For skewed data, the median is better because it isn’t influenced by outliers. Keep reading to learn about the difference between mean vs. mode and when to use which.

Sleep and the Brain: Why You Shouldn’t Skimp on Your Zzzs

Sleep and the Brain: Why You Shouldn’t Skimp on Your Zzzs

What happens in your brain when you sleep? Conversely, what happens in your brain when you don’t sleep? Chronic inadequate sleep leads to a higher risk of many health issues, including dementia and cognitive decline. Extensive research on the effects of sleep shows that sleep is more than just the body’s chance to relax: It’s a vital phase of neural activity and regeneration. Here’s a look at sleep and the brain.