
This article is an excerpt from the Shortform book guide to "Naked Statistics" by Charles Wheelan. Shortform has the world's best summaries and analyses of books you should be reading.
Like this article? Sign up for a free trial here .
How do you calculate investment risk? What do you need to know to calculate the expected payoff of a financial investment?
Investors often use probability to assess risk when making financial decisions. This is typically done with a statistic called an “expected value.” To calculate the expected value of a financial investment, you need to know the probability of each possible outcome and its respective payoff.
Here’s how to use the expected value statistic for calculating investment risk.
Editor’s note: This article is part of Shortform’s guide to saving money. If you like what you read here, there’s plenty more to check out in the guide!
Using Probability to Make Financial Decisions
Investors use the “expected value” statistic for calculating investment risk. To determine the risk of a financial investment, we multiply the financial payoff for each possible outcome by its probability and then add them all together.
For example, say you were interested in building a tiny house on your property to rent to tourists. It will cost $50,000 to build the house. Based on location and current market demand, you estimate a 25% chance that the house won’t be rented at all during the first two years, a 50% chance that it will be rented “part-time” and earn $1,500/month, and a 25% chance that it will be in high demand and rented “full time,” earning $3,000/month. To calculate the expected value of the investment during your first two years, you would multiply $0 by 25%, $36,000 (for two years of part-time rentals) by 50%, and $72,000 (for two years of full-time rentals) by 25%, and add them together for an expected value of $36,000.
Wheelan explains that we can represent the calculations for the expected payoff visually in a decision tree. For your tiny house, your decision tree would look like this:
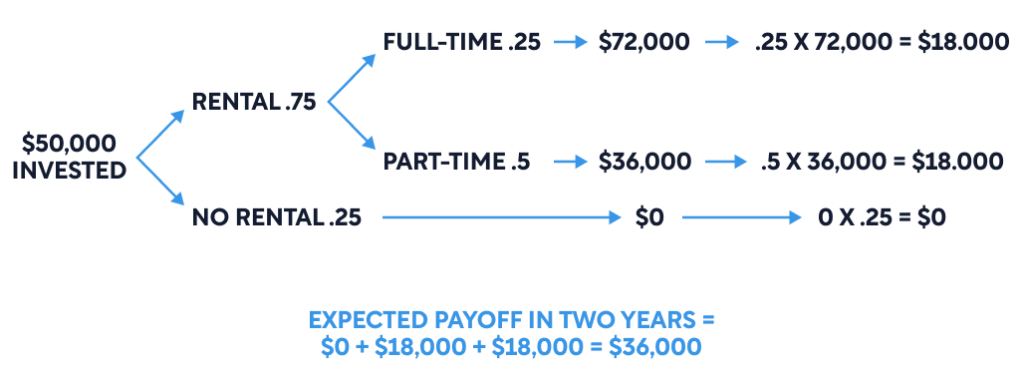
Again, probability dictates that your investment is likely worth $36,000 in the first two years. But looking at your decision tree, you can also see that it’s reasonably likely that you’ll make no money at all and also reasonably likely that you’ll only make $18,000.
The decision tree highlights an important lesson in probability: Probability is a tool, not a guarantee. Unless the probability of an event is zero or 100%, we should always be prepared for an unlikely outcome. Wheelan reminds us that statistically improbable things happen all the time (someone’s “illogical” ticket purchase will win them the lottery!).
Since no outcome is guaranteed, Wheelan explains that we all use probability differently depending on our goals, motivation, risk tolerance, and so on. For example, Wheelan points out that the expected value becomes a more and more useful statistic as the number of financial risks one takes increases. Real-estate developers, for instance, can use this tool to make sure that their multiple investments are likely to make money as a whole. Even if one property loses money or underperforms in a given year, as long as the expected value of their portfolio is profitable overall, they are likely to make money.
Decision Trees for Purchasing Stock
As Wheelan explains, probability is an effective tool for managing risk. Unfortunately, many of us underutilize probability when investing in the stock market. Research shows that we tend to overestimate the probability of rare events and our ability to foresee them. For example, people will often invest in a single stock that they think will be the next Apple instead of spreading their investment across a diverse portfolio. This desire to “hit the jackpot” instead of earn a more modest yet statistically likely return on their investment leads people to under-diversify their stock to the detriment of their wallets. Data suggests that these errors in judgment cost the average investor $2,500 per year.
Using a tool to assess the probable outcomes of our financial investments, such as the decision tree described in this section, is likely a good idea before investing in the stock market. With a decision tree, our “gut feeling” about a stock can be tempered by math, and we may make smarter investments.
Learn how to manage financial risk in general.
———End of Preview———
Like what you just read? Read the rest of the world's best book summary and analysis of Charles Wheelan's "Naked Statistics" at Shortform .
Here's what you'll find in our full Naked Statistics summary :
- An explanation and breakdown of statistics into digestible terms
- How statistics can inform collective decision-making
- Why learning statistics is an exercise in self-empowerment

: A Beginner’s Guide")


