
This article is an excerpt from the Shortform book guide to "Naked Statistics" by Charles Wheelan. Shortform has the world's best summaries and analyses of books you should be reading.
Like this article? Sign up for a free trial here .
What is the R2 statistic? What does the value of R2 tell us about the change in the dependent variable?
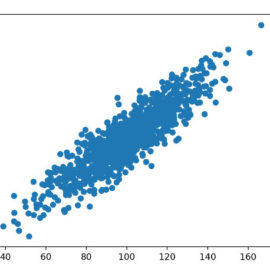
The R2 statistic represents the proportion of the variance in the dependent variable that stems from the change in the independent variable. When using the R2 statistic to quantify the association between independent and dependent variables, it’s important to keep in mind that the R2 in linear regression only applies to linear relationships. It’s possible for two variables to be related, just not in a linear way.
Here’s a look at the R2 statistic in linear regression.
The R2 Statistic
Thanks to a statistic called the R2 statistic, regression analysis can tell us how much of the change in the dependent variable is predictable by changes in the independent variable. In our chemical exposure example, for instance, R2 can tell you how much of a person’s overall cancer risk is determined by their exposure to chemical X, and how much is due to other factors such as smoking, diet, exercise, genetics, and so on.
R2 is reported as a value between zero and one and interpreted as a percent. A value of zero means that our regression equation can’t predict our dependent variable at all, and a value of 1 means that it can predict 100% of the variation in our dependent variable.
In the cancer risk example, if your R2 for chemical exposure was .08, then 8% of a person’s overall cancer risk would be explained by their exposure to the chemical, and 92% would be due to other factors.
R2 Is Only for Linear Relationships in Linear Regression
The R2 statistic is easy to misunderstand and, therefore, easy to use improperly. Often people interpret R2 as encompassing any relationship between the two variables being studied. However, R2 in linear regression only deals with linear relationships.
(Note: There are R2 values for non-linear relationships, but they are outside the scope of Wheelan’s text, which only covers linear regression.)
For example, if you were collecting data on algal blooms (which often occur when excessive nutrients make their way into waterways and algae populations explode), you might plot nutrient levels on your x axis and algae growth on your y axis. During an algal bloom, algae growth will likely follow a non-linear exponential curve. Therefore, your R2 might be zero even though there is a strong relationship between the two variables.

———End of Preview———
Like what you just read? Read the rest of the world's best book summary and analysis of Charles Wheelan's "Naked Statistics" at Shortform .
Here's what you'll find in our full Naked Statistics summary :
- An explanation and breakdown of statistics into digestible terms
- How statistics can inform collective decision-making
- Why learning statistics is an exercise in self-empowerment


