

This article is an excerpt from the Shortform book guide to "101 Design Methods" by Vijay Kumar. Shortform has the world's best summaries and analyses of books you should be reading.
Like this article? Sign up for a free trial here.
Why should you use a product comparison table to beat out the competition? How do you create this table?
Product comparison tables are helpful for any business owner who wants to be the best in their market. 101 Design Methods by Vijay Kumar explains how you can use this type of table to discover trends, brainstorm solutions, and identify patterns that will make your product better.
Check out how to create a product comparison table with Kumar’s seven tasks of innovation.
Comparison Table
Kumar uses the product comparison table extensively to compare the properties of different products, services, or options. To build a product comparison table, label the rows and columns of a table with the things you want to compare. Then, in the box where they intersect, describe how that row and column relate to each other. This ensures that you compare every possible combination.
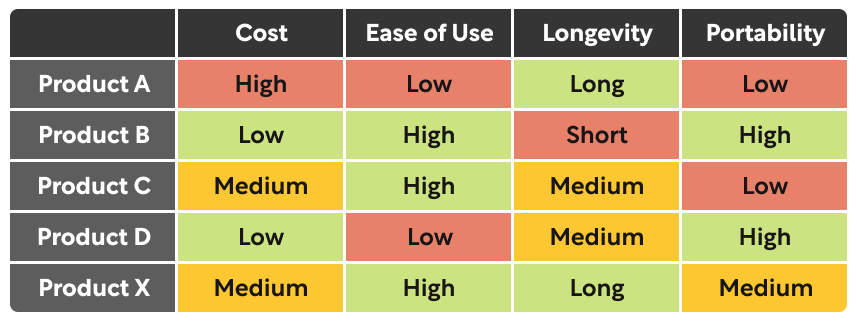
If you want to compare several different products, you might list the products as rows and factors of interest as columns, as shown below. You can color-code boxes with similar results to make the similarities stand out.
If you want to compare several different products, you might list the products as rows and factors of interest as columns, as shown below. You can color-code boxes with similar results to make the similarities stand out.
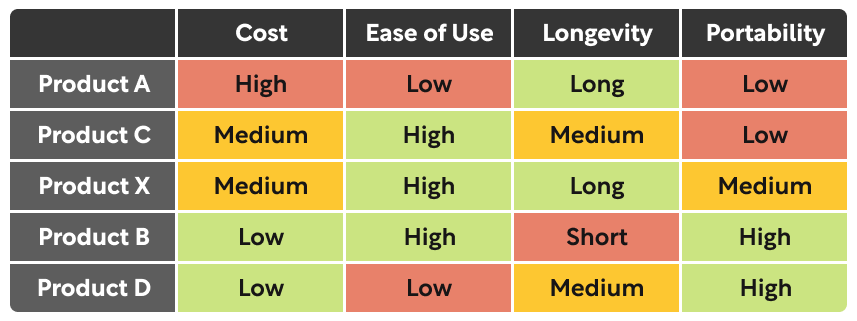
After doing your initial comparison, you might rearrange the rows as shown below to make similarities and other patterns stand out more clearly. For example, in the table below, it is more obvious that Product X resembles an improved version of Product C, and that there’s an inverse relationship between cost and portability for most of these products.
Applications for Comparison Tables
Using the seven innovation tasks below, you can apply the product comparison table to your business strategy effectively:
- Develop a clear idea of what you intend to accomplish
- Define your operating environment
- Understand your stakeholders
- Develop a mental model
- Brainstorm solution elements
- Assemble and evaluate comprehensive solutions
- Plan to implement the solution
In Task 1, Kumar recommends using a table to assess trends in technology, business, people, culture, and politics. Use these as columns and add as many rows as you want for different topics or market sectors. Briefly summarize the trends you’ve identified from media surveys or other research in each box.
Kumar notes that comparison tables are useful in Task 4 for identifying relationships and extracting trends from the data that you gathered in Tasks 2 and 3.
In Task 5, Kumar says you can use a comparison table to aid in brainstorming solutions: List the different phases of the product life cycle as columns and the user profiles or personas that you’ve identified as rows. Then brainstorm ways to improve the user experience for each archetypal user at each stage of the product life cycle.
In Task 7, Kumar recommends building a table that lists your company’s resources or capabilities as columns and the different phases of your solution implementation plan as rows. This helps you assess what resources or capabilities will be needed when so that you can develop your implementation schedule and budget.
Using a Comparison Table to Rank Options
Kumar focuses on how you can use a comparison table to identify patterns and similarities between things or to create new ideas. In addition to these uses, comparison tables are also particularly useful any time you need to objectively rank options in order of preference or importance.
To develop your ranking, label the rows and columns with the factors you want to compare—the list on each will be the same. Then, where each pair of options intersects, compare just those two options. Ask yourself, “Is the option on the row better or more important than the option on the column?” If so, put a 1 in the box; if not, put a 0. Then add up the number of 1’s in each row. The higher the number of 1’s, the higher the option in that row ranks, giving you a more objective way to rank all the options from best to worst. This works because it’s usually much easier to determine which option is better when you only have two options to compare than if you’re trying to compare multiple options simultaneously in your head.
For example, if you’re trying to determine what features of a certain product are most important, you might make the following comparison table:
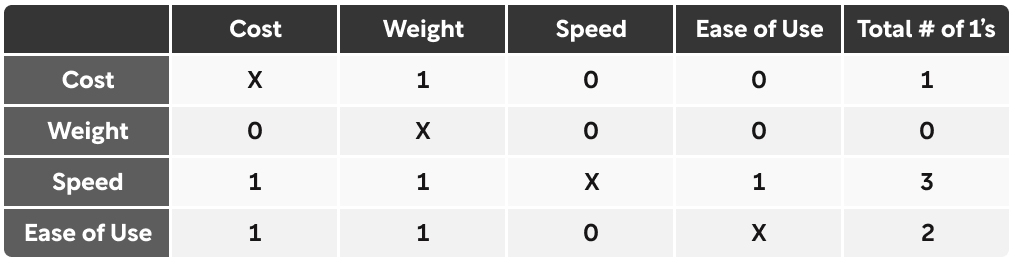
The above table indicates that speed is your product’s most important feature, followed by ease of use, while weight is its least important feature.
The need to rank options may come up in several of Kumar’s innovation Tasks. In Task 1, you might use the table technique to rank different sectors or applications in terms of how promising they look. Then you do further research on the top two or three.
In Task 3, you could have a user fill out a comparison table listing different features or capabilities of a product so you can get a more concrete understanding of which features are most and least important to users.
And ranking your solutions in Task 6 can help you set priorities for prototyping and planning further development.
———End of Preview———
Like what you just read? Read the rest of the world's best book summary and analysis of Vijay Kumar's "101 Design Methods" at Shortform.
Here's what you'll find in our full 101 Design Methods summary:
- Why many companies don’t understand how to manage innovation
- A systematic approach to innovation management
- Specific tools and techniques you can use on innovation projects


These are some great tips! A great application of comparison tables is to set yourself apart from competitors. This way, your users have an easy way of seeing why they should work with you over your competition.